Putting a Value on Your E&P Software
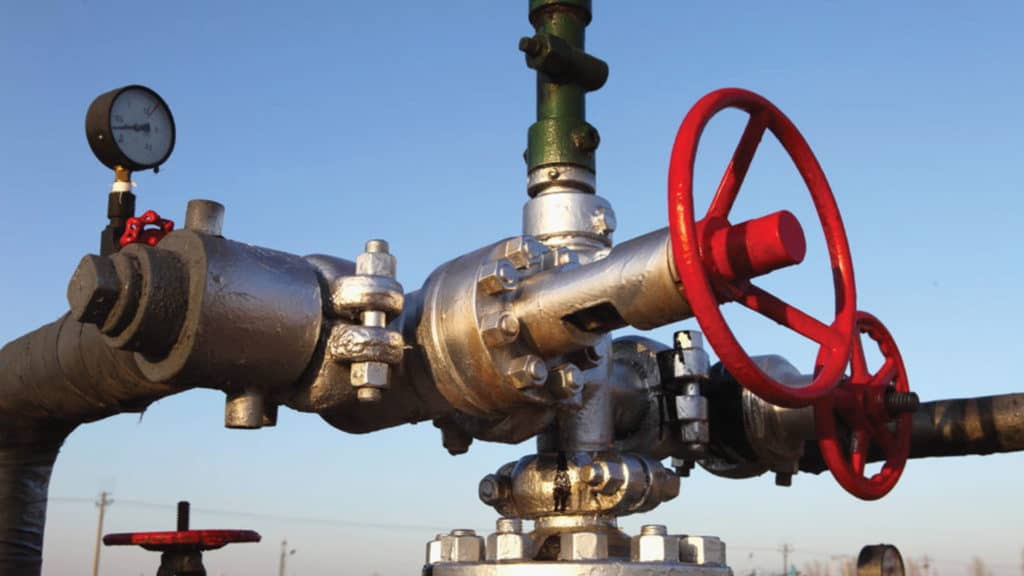
For every barrel of oil and MCF of gas produced, it goes without saying that measurement is important in the petroleum industry, yet when it comes to measuring the performance of E&P software solutions, the gauge is often missing. Just as a well isn’t complete without metering, E&P companies should get a good reading on the business value their production reporting software delivers.
Oil and gas production tracking software has many benefits, including a clearer view of assets and improved operational efficiency. Reduced costs, lowered risks, improved cycle times, and increased revenue opportunities are other business benefits. And cloud-based software offers reduced total cost of ownership (TCO) and “economy of scale.”
Measuring the business value that a production reporting product creates for an oil & gas operator is essential in revealing whether companies are getting a return on their software investment. To do that, software owners (or renters if in the cloud) should focus in on a few clear and quantifiable benefits. Reduced well downtime, improved data handling efficiency, and improved data accuracy are some of the real-world metrics we use to track ROI. The following examples can be adapted to your business situation.
Problem Wells
An E&P company operates 150 wells with an average of 10 problem wells per month. Before the company deployed a production tracking system it took about 16 hours to respond to and remediate well production issues. After deploying operational dashboard software, the company was able to reduce response time to 6 hours, resulting in approximately 125 barrels of oil equivalent produced due to reduced well downtime. Assuming an oil price of $40, the operator realized $5,000 in optimized production per month.
Manual Data Handling
At the same E&P company, a staff member spent about 2 hours each day manually inputting operational and production data readings e-mailed from the field and an additional 1.5 hours each day e-mailing reports to partners and responding to requests for data. After deploying a production monitoring system with field data capture and partner data sharing capabilities, time spent manually handling data was reduced to 30 minutes a day. Assuming an hourly rate of $40 for the employee, the company realized an average of $2,400 per month from improved data handling efficiency.
Inaccurate Production Data
Before deploying field data capture and reporting for its 150 wells, the operator encountered approximately 75 data quality issues each month requiring pumpers and office staff to spend 20 minutes each to correct inaccurate production data. Deployment of field data capture and production tracking software reduced data accuracy issues by 65 per month. Assuming an average hourly rate of $40 for employees, the company realized $1,733 in savings per month.
Return on Investment
The E&P company in these examples realized a $9,133 monthly cost savings due to the operational efficiency provided by its production tracking software. Consider the synergy, however, of improved data quality and availability as well as the ability to address well problems before they happen, and the value is much higher.
How much are you paying for your production operations system? Calculate your software ROI by working through a few clear and quantifiable benefits like these examples, adding up the value each provides, and then dividing by the monthly cost of your software.
W Energy Software production operations software has a track record of providing rapid returns on investment, usually paying for itself within a few months with many clients realizing more than a 200% ROI.

Subscribe to Our Insights
Be the first to access blogs, case studies, videos, and more from our experts.