

Business Intelligence in Oil and Gas Industry: 6 Key Benefits
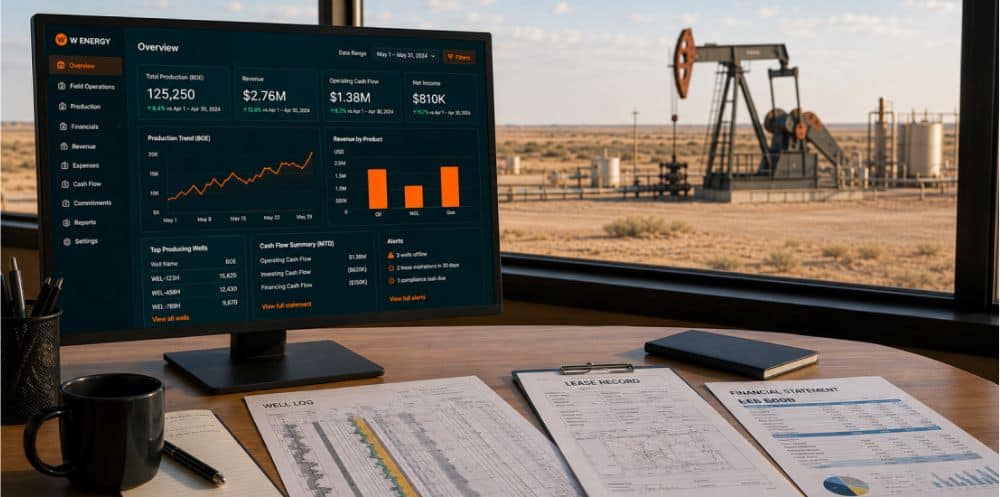
Oil and gas business intelligence gives operators six things that matter most: faster decisions, a single source of truth across teams, quicker time to insight, analytics that non-technical staff can actually use, reporting that scales as the company grows, and tighter control over costs. Put together, those benefits turn scattered field and financial data into something a team can act on the same day, not next week.
Here is a closer look at what business intelligence does and why it pays long term dividends for upstream operators.
What is Oil and Gas Business Intelligence?
Oil and gas business intelligence is the practice of pulling data from across your operation, field production, land records, accounting, and everything in between, then turning it into reports and dashboards people can read at a glance. Instead of exporting spreadsheets from five systems and stitching them together by hand, a good BI tool aggregates the data for you and presents it in a clear view.
The oil and gas business runs on data that lives in a lot of places. Production volumes come from the field. Revenue and expense numbers live in accounting. Lease and obligation records sit with the land team. Business intelligence connects those sources so leaders can see the whole picture and make calls with confidence.
For upstream operators, that connection matters more than in most industries. A single asset touches measurement, allocations, division orders, financials, and land, and each one generates numbers that other teams depend on. When those numbers stay trapped in separate tools, small gaps compound into big surprises at close. A strong BI layer keeps the data flowing between systems, which is where the real value shows up.
6 Benefits of Business Intelligence in the Oil and Gas Industry
Faster, Better-Informed Decisions
When your data is current and easy to reach, you stop waiting for month-end to find out how the business is performing. A near real-time view of field operations lets you spot a problem, understand it, and respond while it still matters. Waiting a day, a week, or a month for answers costs real money in a market that moves quickly. Quicker access to accurate numbers leads to quicker, smarter moves.
One Source of Truth Across Departments
Departmental silos slow everyone down. The field team has one version of the numbers, accounting has another, and leadership has a third. Business intelligence pulls reporting into shared dashboards, so every group works from the same data. Alignment like that reduces the back-and-forth and cuts down on costly errors.
Quicker Time to Insight
Manual data aggregation eats hours that your team could spend acting on what the numbers say. Standard reports and embedded dashboards do the heavy lifting, so analysts spend less time cleaning and combining files. The payoff is more time on analysis and less on prep work.
Analytics Anyone Can Use
You shouldn’t need a data science degree to answer a business question. Modern BI tools simplify the underlying complexity with a clean interface and plain-language descriptions, which puts expert-level analytics in the hands of everyday users. Analysts and executives alike can build the reports they need without waiting on a specialist.
Reporting that Scales with You
Company needs change as the asset base grows. A flexible data model lets your reporting expand or contract without a painful rebuild. Add assets through acquisition or trim the portfolio, and the reporting foundation keeps up, so your team is never boxed in by the tool.
Tighter Cost Control and Efficiency
Clear visibility into operational and financial data helps you find waste and act on it. Seeing expenses next to production, side by side, makes it easier to catch trends early, forecast more accurately, and keep spending in line with the plan. When a lease operating expense creeps up or a well underperforms, you catch it in the dashboard rather than in a variance report weeks later. Better data supports a healthier bottom line.
Discover DataView™ from W Energy
W Energy built DataView™ as an oil and gas business intelligence solution designed specifically for upstream and midstream companies. It integrates data from across your operation into one clear, near real-time view, so you get an instant read on the business without needing a team of data specialists.
DataView supports the tools you already know, with embedded Power BI plus compatibility for Tableau and Spotfire, and it gives you direct access to the underlying data model. Automated data normalization makes those tables business-friendly, standard and customizable reports get you to answers fast, and a scalable model grows right alongside your company. From field to finance, it becomes your single source of truth.
See what expert-level analytics could look like for your operation. Request a demo today, and watch DataView work with your own data.
References:
onepetro.org/SPEADIP/proceedings-abstract/21ADIP/21ADIP/D011S009R002/473823